Native Performance
In this section, we evaluate the performance of our NorthwindDb actor design.
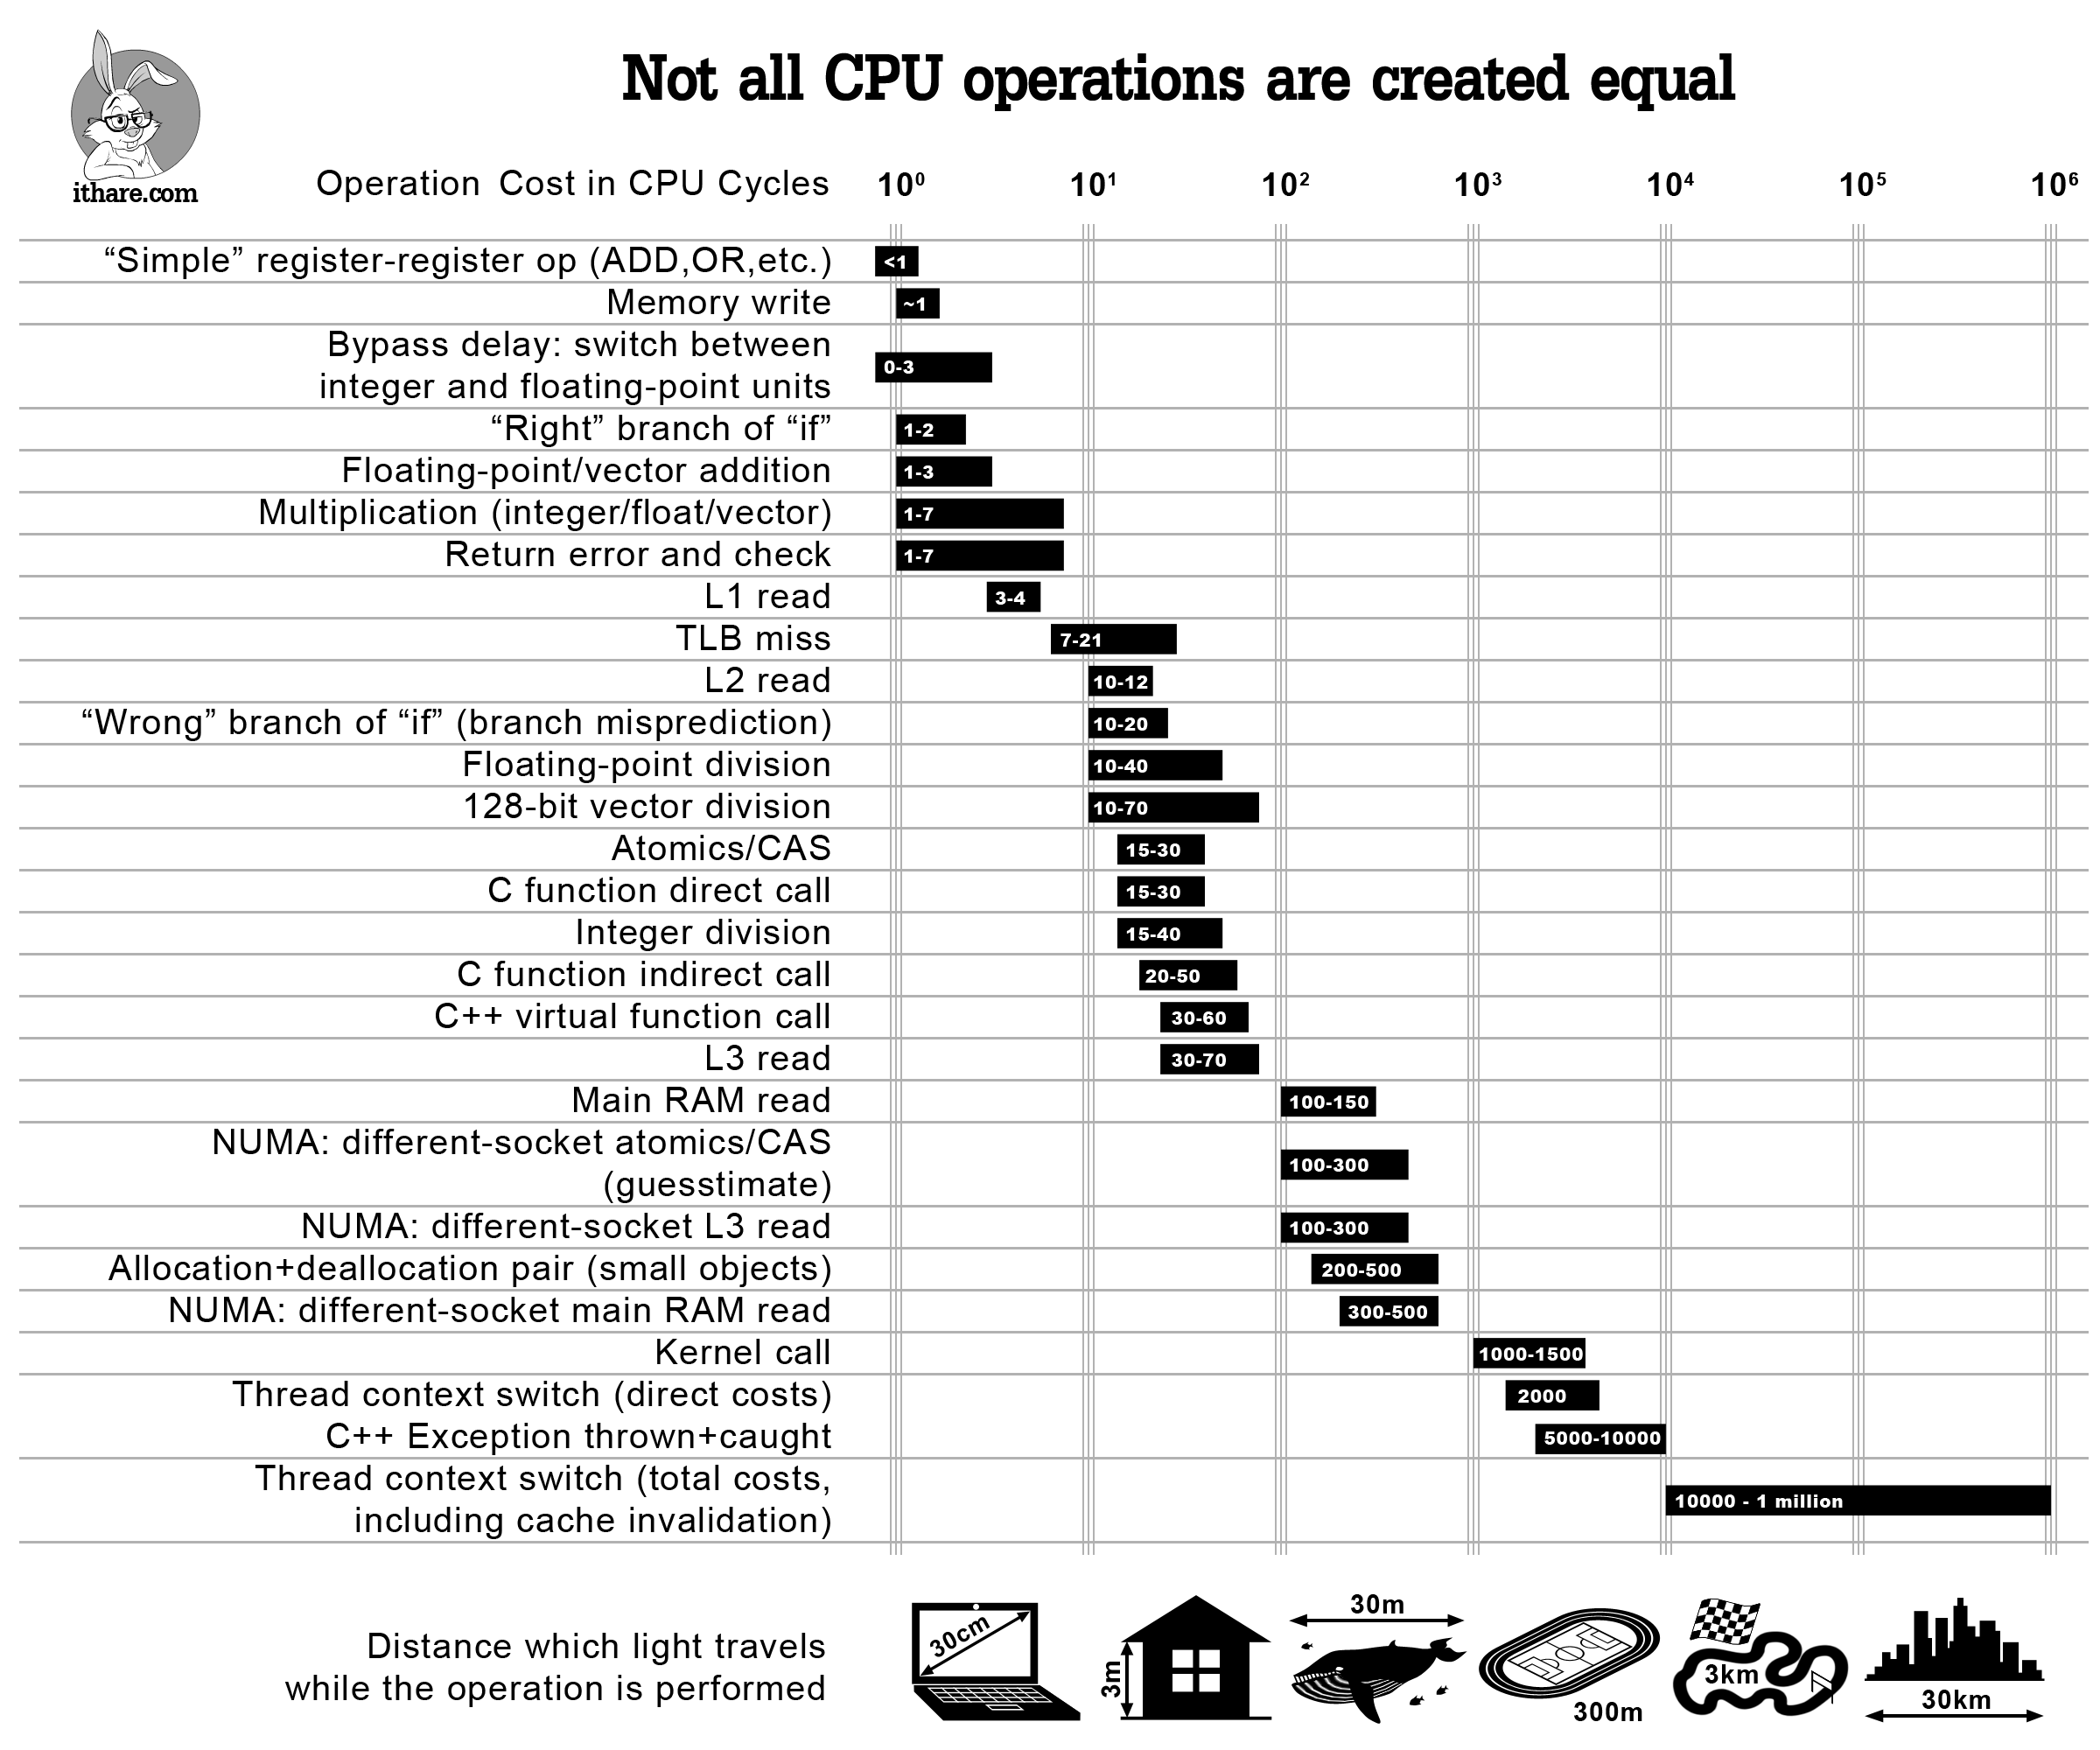
The ultimate goal in scalability is linear scalability, where doubling the number of cores doubles the amount of work your program completes per unit of time, perfect scalability. In practice, this is never achieved (research Amdahl's Law). Moreover, multicore processors can perform worse if applications ignore their effects on CPU caches.
To move our designs toward linear scalability, we must understand how CPUs work best and how to avoid problems created by using threads:
- Threads are heavyweight requiring lots of memory and CPU cycles
- Waiting threads are almost as expensive as active threads
- I/O reads and writes must wait somewhere without blocking threads
In this section we document how:
- Decreasing thread counts may increase throughput for CPU-bound actors
- Increasing thread counts may increase throughput for I/O-bound actors
Performance summary
Read-only NorthwindDb
| Readers | Simulated Latency | Millis per read | Throughput per second |
|---|---|---|---|
| 2 | 0 | 0.00044 | 2,257,829.57 |
Executors and Thread Pools
We use executors to partition our actors into CPU-bound or I/O-bound thread pools. CPU-bound actors do not block threads while waiting and need only a few threads to maintain throughput. I/O-bound actors, on the other hand, block threads while they wait for storage or network I/O to complete. As a consequence, they need more threads to maintain throughput.
The common practice for allocating a thread pool is to allocate n + 1 threads where n is the number of available hardware threads. Brian Goetz, one of the authors of "Java Concurrency in Practice," suggests a formula that uses more threads for I/O bound processes: thread_pool_size = available_hw_threads * target_utilization * (1 + wait_time / compute_time)
The formula above uses two variables to calculate the base allocation of threads for a thread pool available_hw_threads * target_utilization. Next, the formula calculates the ratio wait_time / compute_time and uses it to increase the resulting thread pool size. It increases the pool size dramatically if we are I/O-bound.
Consider a CPU-bound ratio of 1 I/O second for every 10 compute seconds, resulting in a one-tenth increase 1 / 10. Now, consider an I/O-bound ratio of 10 I/O seconds for every 1 compute second, resulting in a 10 times increase 10 / 1. If we have 32 hardware threads, but only want to utilize 25% of them per thread pool, we get:
- CPU-bound thread pool:
thread_pool_size = 32 * .25 * (1 + 1/10)=8.8or9if we round up - I/O-bound thread pool:
thread_pool_size = 32 * .25 * (1 + 10/1)=88
As we can see, this formula allocates far more threads for I/O bound actors. Our example used the simple ratios 1 / 10 and 10 / 1, respectively. In practice, actual pool sizes will vary as wait_time / compute_time varies.
CPU Executors
TODO: Discuss the AffinityExecutor used to produce
0.00044msNorthwindDbread times. Demonstrate how few threads produced higher throughput by reducing cache misses.
NOTE: The following cache misses are for 10 iterations. Replace these examples with single iterations.
With 3 total threads:
1,435,452,059 cache-misses:u
RunNorthwindDb
  Total time: 1,439 millis
  Total reads: 3,100,000
  Millis per read: 0.00046
  Reads per second: 2,154,273.80
With 32 total threads:
5,697,015,968 cache-misses:u
RunNorthwindDb
  Total time: 4,997 millis
  Total reads: 3,100,000
  Millis per read: 0.00161
  Reads per second: 620,372.22
I/O Executors
TODO: Insert an example that leverages more threads to reduce tail latency. Use
NorthwindDbreadLatencyInNanosparameter to simulate I/O read latency and its effect on concurrency.
Comparative Performance
The non-Torq numbers below are, in most instances, best-case numbers. See the underlying references for details. In particular, the DynamoDB numbers are server-side latency numbers that do not include connection and download overhead.
- 0.000000222ms (or 0.222 nanoseconds) -- 1 CPU cycle
- Calculated for a 4.5Ghz processor. Faster CPU clocks perform faster calculations.
- 0.000000667ms to 0.000000888ms (or 0.667 to 0.888 nanoseconds) -- read from L1 CPU cache
- Based on a 4.5Ghz processor.
- 0.00000222ms to 0.000002664ms (or 2.22 to 2.66 nanoseconds) -- read from L2 CPU cache
- Based on a 4.5Ghz processor.
- 0.00000666ms to 0.00001554 (or 6.66 to 15.54 nanoseconds) -- read from L3 CPU cache
- Based on a 4.5Ghz processor.
- 0.0000222ms to 0.0000333ms (or 22.2 to 33.3 nanoseconds) -- read from RAM
- Based on a 4.5Ghz processor.
- 0.00007ms (70 nanoseconds) -- read 1 Northwind customer from a list of 29 customers
- Based on a synchronous, blocking, straight-line Java process using a 4.5GHz processor. Demonstrates nothing is faster than a straight-line process. However, a straight-line process does not support thousands of concurrent users maintaining a database.
- 0.00044ms (440 nanoseconds) -- read 1 Northwind customer using NorthwindDb actor
- Performed asynchronously with 2 underlying
NorthwindReaderactors with affinity scheduling using a 4.5GHz processor. - 0.0172ms (or 17.2 microseconds) -- send 1,518 byte ethernet packet
- Based on a 1GbE and 5 microsecond switch latency. Where
network_latency = (packet_size_bits / bit_rate) + switch_delay. - 0.5ms to 1.0ms -- DynamoDB DAX (server-side latency)
- "Amazon DynamoDB Accelerator (DAX) is a fully managed, highly available caching service built for Amazon DynamoDB. DAX delivers up to a 10 times performance improvement—from milliseconds to microseconds"
- 2.0ms -- Solid State Drive
- Micron 7450 NVMe -- "The Micron 7450 SSD addresses QoS needs with industry-leading, 99.9999% mixed-workload read latencies under 2 milliseconds (ms) while still delivering hundreds of thousands of IOPS."
- 5.0ms to 10.0ms -- DynamoDB (server-side latency)
- "For example, DynamoDB delivers consistent single-digit millisecond performance for a shopping cart use case, whether you've 10 or 100 million users."
References:
- https://faculty.cs.niu.edu/~berezin/463/Assns/clocks.html
- http://ithare.com/wp-content/uploads/part101_infographics_v08.png
- https://aws.amazon.com/dynamodbaccelerator/
- https://aws.amazon.com/blogs/database/understanding-amazon-dynamodb-latency/
- https://www.micron.com/about/blog/storage/ssd/micron-advanced-workload-demands
- https://www.youtube.com/watch?v=PLApcas04V0
- https://penberg.org/papers/tpc-ancs19.pdf
- https://github.com/OpenHFT/Java-Thread-Affinity
- https://scalac.io/blog/improving-akka-dispatchers/
Evaluation output
Timings
RunNorthwindJava
RunNorthwindJava
  Total time: 13 millis
  Total reads: 200,000
  Millis per read: 0.00007
  Reads per second: 15,384,615.38
NorthwindDB
1 writer and 2 readers (taskset -c 0-2):
RunNorthwindDb
  Total time: 1,373 millis
  Total reads: 3,100,000
  Millis per read: 0.00044
  Reads per second: 2,257,829.57
Hardware used
Listing produced using lscpu:
Architecture:             x86_64
  CPU op-mode(s):         32-bit, 64-bit
  Address sizes:          48 bits physical, 48 bits virtual
  Byte Order:             Little Endian
CPU(s):                   32
  On-line CPU(s) list:    0-31
Vendor ID:                AuthenticAMD
  Model name:             AMD Ryzen 9 7950X 16-Core Processor
    CPU family:           25
    Model:                97
    Thread(s) per core:   2
    Core(s) per socket:   16
    Socket(s):            1
    Stepping:             2
    CPU(s) scaling MHz:   25%
    CPU max MHz:          5881.0000
    CPU min MHz:          545.0000